Sunday, October 16, 2016

Lab#11: Kinetic Energy and the Work-Kinetic Principle

Kinetic Energy & Work-Kinetic Principle

Samuel
Ellis
Mia
10-5-2016

Purpose:

To measure the work done as we stretch cart with spring acting on opposite direction.

Theory:

We all know the formula work equal to force times distance and the law of conservation of energy. By assuming there's no friction, the energy will equal to each other. Furthermore, when a cart is moving on a surface with a spring attach on the opposite direction, the kinetic energy will equal to spring potential energy. Then we can determine the force acting on the spring and its velocity.

Procedure:

EXPT 1.
1. Calibrate the force prob with a force of 4.9 N applied.
2. Set up the ramp, cart, motion detector, force prob, and spring.
3. Use cart stopper at the end of ramp
4. Be sure the motion detector sees the cart over the whole distance of interest.
5. Open the experiment file called L11E2-2 to display the force vs. position axes.
6. Zero the force prob and motion detector with the same supported loosely and un-stretched.
7. Verify that motion detector is set to "Reverse Direction", so that toward the detector is positive.
8. Begin graphing force vs position as the cart is moved slowly towards the motion detector until spring is stretched about 0.6 m.

EXPT 2
1. Use same set up as above.
2. measure the mass of the cart
3. Under control, new calculated column, enter a formula that would allow you to calculate the kinetic energy of the cart at any point.
4. Be sure that motion detector sees the cart over the whole distances of interest.
5. Make sure that x-axis of your graph is "position". Zero the force porb with the spring hanging loosely. Also zero the motion detector, so both the forced and position are zero in the starting position. Then pull the cart along the track so that the spring is stretched about 0.6 m from the un-stretched position.
6. Begin graphing. and releasing the cart, allowing the spring to pull it back at least to the un-stretched position.
7. Find the change in kinetic energy of the cart after it is released from the initial position to several different final position. Use the Analysis, Examine feature of the software. Also find the work done by the spring up to that position. Record these values of work and change in kinetic energy in a table determine from your graph the position of the cart where it is released and record in in the table.


Data:

( Above is the graph that shows time, force, position and kinetic energy. When the cart started to accelerate toward spring, the motion sensor calculate the change in distance. Furthermore, kinetic energy column was calculated by input equation of 0.5*m*v^2, in which mass is given and velocity is based on the motion sensor.  


Conclusion:

In this experiment, we released spring to see how fast the cart we accelerate and distance it traveled. By using force prob and motion sensor, it capture wave very rapidly. So we can have an accurate data. We did find the area under the curve from different energy and work. Since work and kinetic energy are related, we can set them equal to each other to measure our answer come out correctly. The one only error I know is that between wheels and track there's little kinetic friction acting on it. It will affect the speed of the cart, which can ultimately affect work(force * distance). Since work don't require what happen between wheels and track, the final answer will come out slightly different.


Lab #9: Centripetal Force with Motor

Centripetal Force with Motor 

Samuel
Ellis
Mia
10-3-2016

Purpose:

To determine the relationship between angular frequency to angle at which it swing.

Theory:

When an object is spinning, there will be a centripetal force acting on the object. In addition, faster the spin is, the higher the object will be. Since centripetal force is increasing, the force in y-component is also increasing. In result, object will increase in height. We can use height, angle and time to determine it velocity.

Procedure : 

1. An electric motor mounted on a surveying tripod.
2. A long shaft going vertically up form the shaft.
3. A horizontal rod mounted on the vertical rod.
4. A long string tied at the end of the string.
5. A ring stand with a horizontal piece of paper or tape sticking out. 
6. Start motor, and make sure object hit the paper.
7. Record height of paper and time for 10 rotation.
7. Increase speed and repeat same procedure.


List/Data:

(1)
t = 31.06 sec
h = 63 cm

(2)
t = 26.75 sec
h = 92.3 cm

(3)
t = 23.7 sec
h = 102.3 cm

(4)
t = 19.16 sec
h = 144.3 cm

(5) 
t = 15.46 sec
h = 167.8 cm

(6)
t = 34.00 sec
h = 51.5 cm

Calculated Result:


H = 203.8 cm
R = 70 cm
L = 185.1 cm
h_initial = 127.6 cm
θ_initial = 43.57 degree


ω = θ/t  = (2*π*10)/t

   T*sin(
θ) = m*r*ω^2
/  T*cos(θ)= m*g
_______________________
   Tan(θ) = (r*ω^2)/g

Sqrt((g*tan(θ))/r) = ω

  ω      
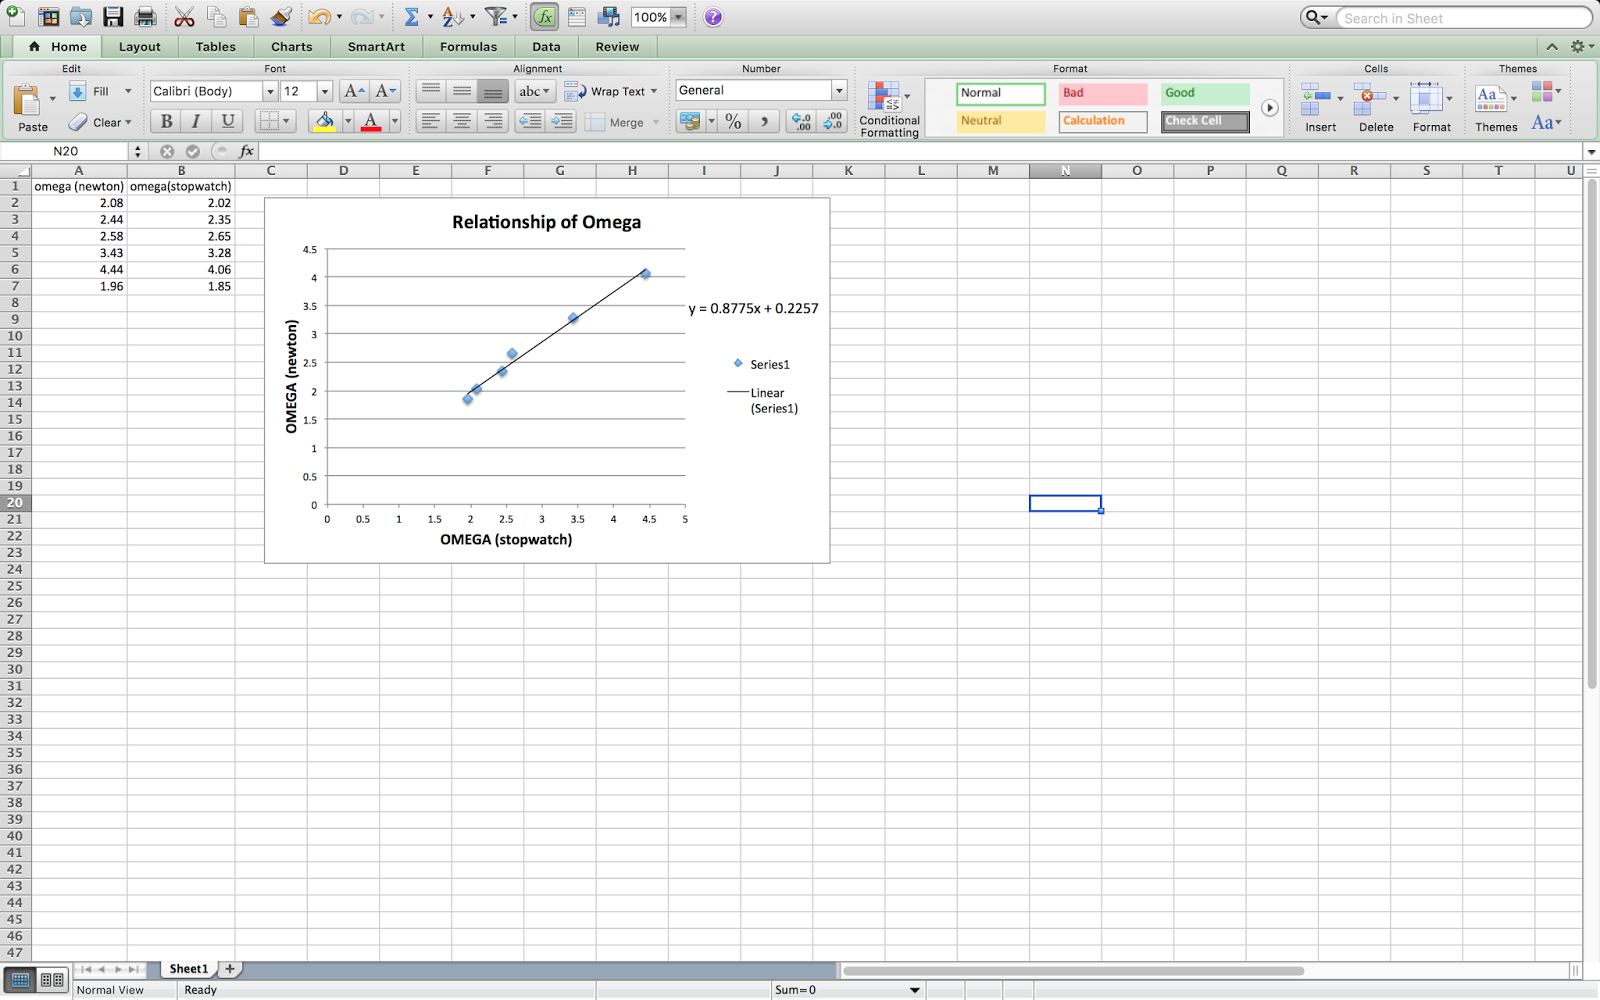
2.08   2.02
2.44   2.35
2.58   2.65 
3.43   3.28
4.44   4.06
1.96   1.85


(Above is the graph of ω(stopwatch) vs. ω(height) graph. By plotting omega time verse omega height, we can linear fit the slope and get the resulting angular velocity(0.8775))

Conclusion:

This experiment is based on centripetal force and its angular velocity. We first set motor to same voltage, which gave consistent velocity to spinning object. Then used paper as a hit point to see what's the resultant height of different centripetal forces. There's a little different between calculated value and actual value. My first assumption is air-resistant, we did not include air-resistant into our experiment. Air-resistant depend on size and speed of the object, bigger or faster the object, more air-resistant will have. Since we kept on increasing the spinning velocity, which increase it force. Then the air-resistant will also increase, result in little different from calculated value from actual value. Also, human error, the measuring tool we used to measure the height is regular ruler. There might be slight error from human eyes based on different angle from what he/she viewed. 


Lab #8: Centripetal Acceleration vs. Angular Frequency

Centripetal Acceleration vs. Angular Frequency 

Samuel
Ellis
Mia
9-28-2016

Purpose: 

  To determine the relationship between acceleration and angular speed.

Theory:

Centripetal acceleration , a = r*w^2. Centripetal acceleration can be determine by the radius of disk and how fast is the disk rotating. When an object is on the rotating disk, there's will be a centripetal acceleration force point to the center of the circle and a tangential force point perpendicular to the centripetal force. Based on what we know about centripetal acceleration, we can find centripetal force acting on the object.

Procedure:

1. Place the accelerometer under on the disk and connect them to the wheel. Verify that accelerometer reads 0 in the x-direction.
2. Place wheels up against the bottom of the disk. On the top of the disk, place an object with know distance from center of disk. 
3. Connect force prob to the object. 
4. Tape a piece of paper on the edge of the disk. Measure scanner can scan it every time paper pass through.
5. Collect period and acceleration data for a variety of rotational speeds by varying the voltage from the power supply feeding the motor. 

List/Data

(1)
r = 20.5cm
6.4 v
200g
t = 16.5sec

(2)
r = 29.5cm
6.4v
200g 
t = 15.4sec

(3)
r = 41cm
6.4v
200g
t = 14.37sec

(4) 
r = 58cm
6.4v
200g
t = 14.33sec

(5)
r = 58cm
7.0v
200g
t = 12.38sec

(6)
r = 58cm
7.6v
200g
t = 11.16sec

(7) 
r = 58cm
7.3v
200g
t = 12.47sec

(8)
r = 58cm
7.3v
50g
t = 10.74sec

Graphs

(Above is the graph of r*w^2 vs. force graph. We used r*w^2 instead of m*r*w^2, so we can use the slope to determine the mass. The slope is 0.2028, which is close to the mass of the object 0.2 kg.)


(Above is the graph of w^2 vs. force graph. we used of w^2 instead of m* r*w^2 so that we can use slope to find mass times radius. The slope is 0.1267 which is close to real mass times radius, 0.116.)

Conclusion:


  Based on what we know about centripetal acceleration, we are able to use formula to find its radius, angular frequency and mass. By plotting those point into LoggerPro, and use linear fit to find its slope; which will give us the expected value for radius, angular frequency and mass. In this experiment, our expected value was indeed close to actual value, however, there are some error occur during experiment that cause data not exactly match with given value. First, in between wheels and the disk, where are several gap in between that might give inconsistent kinetic friction that cause disk move slower or faster. Also, data was given in 2 to 3 significant figure, which is not precise compare to data in LoggerPro(5 sig fig).


Friday, September 30, 2016

Lab #3: Non-constant acceleration

Non-Constant Acceleration

Samuel
Ellis
Mia
9-12-2016

2.

Find how far the elephant goes before coming to rest.

3.

In calculus, when we were given position function, we take derivative of the function to find its velocity or acceleration. If we were given acceleration function, we can take the integral to find the velocity and position. In this case, the mass of rocket is changing. We can use acceleration equal force divide by mass to find acceleration.  Then use that to find its position.

 4.

1. open up a new excel spreadsheet.
2. put appropriate values in for v_o and x_o.
3. set delta t to be 1 second. put in the other appropriate values in cells B1  through B4.
4. Input a formula into cell A9 that will calculate the appropriate time, and that you can fill down. Use $B$5 into your formula, so the cell will let you calculate the acceleration at any time. Fill that formula down to cell B9.
5. Input cell C9 calculate the average acceleration for that first delta t interval.
6. In cell D9 calculate the change in velocity for the first time interval.
7. In cell E9 calculate the speed at the end of that time interval.
8. In cell F9 calculate average speed at at end of time interval.
9. In cell G9 calculate the change in position of the elephant during that time interval.
10. In cell H9 calculate the position of the elephant.
11. Change the time interval from 1 second to 0.1s and see if makes a different.
12. Change the time interval to 0.05 instead of 0.1s and see if makes a different.

5. & 6 &7


( The difference between those data is the change in time interval, and the highlighted area is for time = 1, 0.5,0.01. and we got 248, 248,248)

8.

In conclusion, we had used integral to find the displacement for elephant, by putting data into excel and create bunch function. Then we change the time interval to see if it will make the different, the answer is NO.

Lab #2: Free Fall

Free Fall

Samuel
Ellis
Mia
8-31-2016

2.

To examine in the absent of all other external forces expect gravity, a falling body will accelerate at -9.8 m/s^2

3.

Theory: In physics class, we always assume gravity will be -9.8 meter per second square. In the real world, however, it doesn't always happen that way. At different location, gravity will vary from -9 meter square per second to -10 meter square per second. So in this experiment, we let gravity to be our only source of force. By letting gravity act on an object, we can determine how fast it accelerate downward. And since gravity is the only force acting on that object, the acceleration will be gravity.

 4.

1. Pull a piece of paper tape between the vertical wire and the vertical post of the device. Clip it with a weight to keep the paper "tight".
2. Turn the dial hooked up to the electromagnet up a bit.
3. Hang the wooden cylinder with the metal ring around it on the electromagnet.
4. Turn on the power on the sparker box.
5. Hold down the spark button on the sparker box.
6. Turn the electromagnet off so that the thing falls.
7. Turn off the power to the sparker thing.
8. Tear off the paper strip and set up the spark paper for the next person to get their data.
Excel:
1. select your data in columns D and E. Click on the Chart tab, then choose scatter, then Marked Scatter to give an XY (scatter) graph with the point NOT connected.
2. Use the Chart Layout tab to give appropriate titles (with unit) for your graph and your graph axes.
3. under the chart layout tab click on trendline, choose trendline option. choose a liner fit. under the options choose "display equation on chart" and "display r-squared value on charf". when you click "OK" this should give you a line and equation on the graph. Double-click on the equation on your chart. use the numbers formatting to get a reasonable number of decimal places in your answers. use the font menu to make the equation large enough that it will show up nicely when you to print or photograph your graph. 
4.Select column A and B. follow the same steps above except when you get to add trendline choose a polymonial fit of order 2.

5 & 6


(we first measure the distance between each dot(at least 14). Then input data into computer using excel, then follow the procedure above.By using linear fit, we can get an equation of the linear line. Which give up the Constance.  At the end we got speed vs time & distance vs time graph. Then we the number we got in the graph, which is 901 as our gravity Constance.

(this is the data from other groups)

8.

At the end, our calculation shows that gravity for our experiment is around 9 meter per second square. Which is lay between 9 and 10, so its normal. Gravity constance vary at different location. In conclusion, we find the acceleration of gravity by using the distance between dots and know the punch time for each dots. Then plot those data using excel and use linear fit to find gravity. 

Monday, September 26, 2016

Lab#6: Propagated Uncertainty in Measurements

Propagated Uncertainty in Measurements

Samuel
Ellis
Mia
9-7-2016

2.

Every experiment have its little error, to avoid these error we have to get a more precise equipment. Or we can use uncertainty measurement to find the error range so we can know what value is our answer lay between.

3. 

To use propagated uncertainty, we first have to know what +- the measurement lay between and we also need to know how to take partial derivative. To calculate uncertainty, we have to find the answer without using uncertainty and then take a square root of double uncertainty(^2), so we get a constant value.

4.

1. Watch lecture online in Moodlerooms about propagated uncertainty.
2. weight metals
3. Measure two different metals using calipers.
4. Determine it uncertainty and record your data.
5. Calculate uncertainty using above data.

5.

We were given two cylindrical shapes metal but in different material and length. Longer one is aluminum and shorter one is iron.(measurement below) 

6.

 we got an equation using square root of doubling everything to get uncertainty for metals. 2nd picture is uncertainty for aluminum. 


7. 


8.

The more accurate we want our data to be, we either need to get more precise measuring tool or use propagated uncertainty to the how much error is our actual answer differ from the most accurate one.
By taking partial derivative, we can find uncertainty.  

Lab #4: Modeling the fall of an object falling with air resistance

Air Resistance

Samuel
Ellis
Mia
9-19-2016

2. 

We have an expectation that air resistance force on a particular object depends on the object's speed, its shape, and the material it is moving through. We can model this expectation as a power law. 

3.

Power law = F_resistance = kv^n. k is constant(shape of object density of air), v is speed. To determine a falling object, we need to know it speed and exponent and base on those data we can find air resistance. 

4.

  1. Turn on LoggerPro, open "video capture" 
  2. Capture video for 1,2,3,4, and 5 coffee filter falling from balcony.
  3. Get terminal velocities for each one by fitting the linear portion of the position vs time graph for each.
  4. Plot your data appropriately to determine values for k and n. 
  5. In excel worksheet, label t, a, delta v, and v.
  6. Set t = 1/30 of a second
  7. Once you have calculate columns in excel for v and x as function of times, determine what your model predicts for the terminal velocity of the various coffee filter. 
  

5. 


150 coffee filters = 134.2g
1 coffee filter = 0.895g
Slope
1= 1.537
2=   2.28
3=   2.74
4=   3.33
5=    4.10

A= 0.00419+- 0.005
B= 1.777+- 0.1179

6.


 (Then we input different mass of coffee filter to get air resistance force)


(Find in what time does velocity stop increasing) 

7.


Above, is the speed vs air force graph. We inputted the speed of coffee filter(s) from 5 different weights along with their air-resistance force. And then used "power fit" curve to find the equation of the curve, which turn out to be k= 0.00419+- 0.0005 and n= 1.777+-0.1139. 

8.

At the end, we generate an equation for air-resistance force acting on coffee filter. Air-resistance force increase as velocity increase. We first determine filters speed by video taping it falling speed, then used 1 meter ruler in the video for reference distance so we can plot point as every 1/30 of a second. So we find our speed and time, we just need to use power fit to find its equation.