Monday, October 31, 2016

Lab#14: Ballistic Pendulum

Ballistic Pendulum

Samuel
Ellis
Mia
10-12-2016

Purpose:

Determine the firing speed of a ball from a spring-loaded gun.

Procedure:

1. Measure/record the mass of the ball and block
2. Level the base of the apparatus.
3. Make sure that the block is level.
4. Pull back and lock the spring into position(There are three possible "notches" you can pull back to. Record which notch you are using.) Place the ball into position. Put the angle indicator to zero degrees.
5. Fire the ball into the ball into the block and record maximum angle to which the block rises. 
6. Repeat this a total of four or five to get an average.
(As the ballet fired into holder, the holder and ballet become in-elastically, which cause the momentum of the block to gain more energy. In which block accelerate upward until gravity pull it down. Since the metal pointer will stay wherever the block last appear. In can indicate what angle gravitational potential energy occur with sin or cos. So we can translate GPE into how much energy spring release.)  

Data:


mass = 85.3 gram
b = 7.7 grams
theta = 21.0 +-0.5 = 0.367 rad
h = 19.2 cm +- 0.1
Second theta  = 21 +-0.5 = 0.367 rad
Third theta = 21+- 0.5 = 0.367 rad
Forth theta = 21 +- 0.5 = 0.367 rad
d = 226 cm +- 26 cm
h = 98.5

Above is the equation we derived to solve for velocity of the ball. We first set kinetic energy equal to Gravitational Potential Energy, then isolate velocity. As result, I got 6.04 meter per second.


Conclusion:

 This experiment is based on understanding of different kind of energy. We have to assume there are  no additional force or energy acting on it. Then we can use energy transfer to find each individual energy. We first measure the angle ball was firing at(did 3 times and then average them out) then with already known mass and gravity, we are able to calculate gravitational potential energy of the block Which will equal to kinetic or spring energy. Based on given data, there are some uncertainty occur in the experiment. We have +- 0.1 for height and +- 0.5 for angle we measured. And according to our uncertainty equation, we got +-0.15 for velocity. 


Lab#13: Magnetic Potential Energy

Magnetic Potential Energy

Samuel
Ellis
Mia
10-12-2016

Purpose:

  Verify that conservation of energy applies to this system.

Theory:

According to Laws of Conservation, all energy must conserve if no additional force is apply to the system. We can determine the energy applied by calculating before and after energy. In addition, by tilting the system, we can turn it into gravity potential energy. With different angles, We can find the relationship between magnetic energy and kinetic energy by measuring the distance it oppose by magnetic force.

Procedure:

1. Level air track (this way you know where to be measuring h from. This is the position the track will be in when you actually do your experiment.)
2. Collect the appropriate data by tilting the track at various angles so that you can plot a relationship between the magnetic force F and the separation distance r.
3. Plot a graph of F vs. r. We'll assume that the relationship takes the form of a power law: F = Ar^n. Get the appropriate values of A and n from a curve fit to your graph. Record the uncertainties in your fit equation. 
4. Determine the appropriate function U(r) for the interaction between the magnetic. 
5. Attach an aluminum reflector to the top of the air track cart.
6. With the air turned off, place the cart on the air track, reasonably close to the fixed magnetic. Run the motion detector. Determine the relationship between the distance the motion detector reads and the separation distance between the magnetic.
7. Now you have a way to measure both the speed of the cart and the separation between the magnetic at the same time. 
8. Set the motion detector to record 30 measurements per second. Under the data menu in the LoggerPro create a New Calculated Column that will let you get the separation between magnetic from the position as measured by the motion detector.
9. Start with the cart at the far end of the track. Start the detector, then give the cart a gentle push.
10. Record whatever the other data you need to verify conservation of energy for the time before, during and after the collision.
11. Make a single graph showing KE, PE, and total energy of the system as a function of time.

Data:


Theta(degree) /Separation(mm):
2(degree)/18.5(mm)
6(degree)/11.9(mm)
13(degree)/8.9(mm)
14(degree)/7.2(mm)
18(degree)/6.5(mm)

Mass of cart: 337.1 grams
Motion detector: 0.399 m
Separation: 46.9 mm 

Graph/Calculated Result:

(Above is graphs of Position vs Time, Velocity vs Time and (Kinetic, Magnetic Potential and Total energy) vs Time. First graph, it shows around 5 seconds there's a reverse direction of where the cart is traveling. That's where the cart got different force from magnet. Second graph shows that at exact moment where position reverse, the velocity became 0 and start increase its speed. Which is correct since magnet push it to other direction. On third graph, total energy vs Time, it shows energy is conserved. Since it is equal to each other, it become 0 when cancelling out with different energy.)

(We plot the points from measuring the angle and separation from the experiment, and used power fit in LoggerPro to find the curve of magnetic force. The curve above is to measure the separation with given angle)

Conclusion:

Overall, the data we got are pretty precise on when and where the change in energy occur(it match up with other graph). In this experiment, we first tilt the track to form potential energy and when cart moves down the ramp and bump into magnetic force then turn that energy into kinetic energy. From that, we turned off the air so we can know the distance it had travel. However, there are still some error during this experiment. First, the ramp angel we measured, it has only 2 significant figure and we average it from 3 different cellular devices. Second, the weight of cart and separation from magnet are measured with 4 significant figure device. Although it is highly precise, there might still have human or mechanical error involve in.  


Lab#12: Conservation of Energy

Conservation of Energy

Samuel
Ellis
Mia
10-05-2016

Purpose:

  Find the force of the oscillating spring and determine whether the energy is conserved or not. In addition, find the relationship between oscillating force and the distances it traveled.

Theory:   

  According to Law of Conservation, we know that all energy must conserve; the initial energy will have to equal to final energy. If the final energy does not equivalent to initial energy, there must be other factor or force acting on it. Since Law of Conservation had been proven correctly,  then we should be able to calculate its final energy from initial energy.

Procedure:


1. Mount a table clamp with a vertical rod to the table. Mount a horizontal rod to the vertical rod. Put a Force sensor on the horizontal rod with the loop of the sensor pointing downward.
2. Calibrate the force sensor using zero mass and 1 kg weight.
3. Put a spring on the force sensor. Zero the force sensor.
4. Put a motion sensor on the floor facing up. Under the sensor setup select Reverse Direction.
5. Place a 50 grams the mass hanger so that it is vertical and spring is just un-stretched.
6. Start collecting data and slowly pull down on the 50 grams mass
7. Now do the same thing for real, collecting force vs. time data and stretch vs time data. Plot force vs stretch to get the equation that defines the force behavior of your spring.
8. Disconnect the force sensor from LabPro. Open up a new LoggerPro file with just the motion sensor attached.
9. Again, place a 50 grams the mass hanger, hang it on the spring, and then support it somewhat so that it is vertical and spring is just unstretch. collect data using the motion sensor and record the position of the bottom of the mass hanger.
10. Hang an additional 200 grams on your mass hanger. Record the position of the 200  grams using the motion detector.
11. Make a new calculated column. Call it 'unstretch'. Set up the formula so that it gives you the stretch of the spring from the unstretch position of the spring based on the position of the bottom of the hanging mass, as record by the motion sensor. 

Data(Graph & Explanation):

(Above graph is Energy vs position & Energy vs Time. The first graph have this back and fort kind of line, the reason why is due to osculating of the spring. Since spring kept on bouncing up and down, the position will have this back and fort line. For the second graph, the energy is conserved. It will just keep on repeating the same line.)

(Above is Position vs Time & Velocity vs Time graph. For the first one, as time increase; the spring goes up and down. For the second graph, velocity is constant with the same back and fort style.) 

(Above, we input some equation for Kinetic, Gravitational potential and elastic energy.)

(Above is kinetic vs position, kinetic vs velocity and GPE vs position. For the first one, it just back and fort line, which is accurate since the spring just keep on moving up and down. Third graph, since the height of the spring is the same, energy is increase when moving higher.) 


Conclusion:

We used gravitational potential energy to find kinetic energy and elastic potential energy. As result we can generate the graph of each individual energy. As you can see in elastic and total energy graph, there are slightly inconsistent line(getting lower and lower). The reason may due to the different gravity(instead of 9.8) or rusticity of the spring and maybe is due to not that accurate of the measuring tools. Those might be the reason why graphs are not consistent. However, its close enough for us to know what it will look like and how it relate to real life situation. Overall, it was a pretty good experimental result for law of Conservation.
  

Tuesday, October 25, 2016

Lab#15: Collisions in two dimension

Collision in two Dimension

Samuel
Ellis
Mia
10-19-2016

Purpose:

  Look at a two-dimensional collision and determine if momentum and energy is conserved.

Theory:

  Assume there's no friction and outside force acting on the objects. When two object collides, their momentum and energy are conserved. According to conservation of momentum, m1*v1i+m2*v2i = m1*v1f + m2*v2f, if its elastic. Which mean no matter how fast or slow the object is, it will have an effect on its final velocity. Moreover, during the collision, all the energy will transfer from before collision to after collision. We are able to use this theorem to calculate how much energy during collision. 

Procedure:

1. Record masses for metal ball and marble.
2. Gently set the stationary ball on the leveled glass table.
3. Set camera on the stick, make sure its able to record the movement for both balls.
4. Aim the rolling ball so that it hits the side of the stationary ball. (The ball should ideally roll off at some decent angle from one another.
5. Log in into loggerpro
6. Go to Options, then Movie Options..., then choose Override frame rate to 60 or 120 fps.
7. Advance the movie 2 or 4 frame(s) after adding a new point. 
8. Start adding point to every position of ball. 
9. Repeat same procedure for rest of ball.


Date:


Collision between white ball with colored ball

White ball(x): 0(initial) - 0.2941(final)
White ball(y): 0(initial) - 0.1910(final)

Colored ball(x): 0.6901(initial) - 0.3269(final)
Colored ball(y): 0.0357(initial)  - -0.2727(final)


Collision between Metal ball with White ball

Metal(x): 0.5308(initial)  ~ 0.5308(final)
Metal(y): -0.3529(initial)  ~ -0.2317(final)
White(x): 0(initial)  ~  0.1589(final)
White(y): 0(initial)  ~  -0.5489(final)


Graph:

(This is the center of mass graph for marble)

(This is the velocity of marble collide with white ball in x and y direction with before and after collision)

(This is the velocity graph of metal ball collide with white ball in x and y direction with before and after collision)


(This is the graph of position vs time for metal ball collide with white ball in x and y direction)

(Momentum for marbles)

(Momentum for metal ball)

(This is the graph of position vs time for marble collide with white ball in x and y direction)

(velocity of center of mass(marble) meter per second)

(Velocity of center of mass for metal ball)

(Energy over time graph for ball)

(Energy of metal ball)

(Graph of center of mass for metal ball)

Calculation:

We are able to calculate momentum and kinetic energy based on the given date(mass and velocity).

Momentum: m1_1 *v1_i +m2_i*v2_i = m1*v1_f + m2* v2_f
Based on conservation of momentum, the momentum will remain the same during before and after the collision if there's no additional force acting on it.

Marble:
final velocity: x= 0.2941, y= 0.1910
Vf = square root of (0.2941^2 + 0.1910^2)
     = sqrt((0.2941^2) + (0.1910^2))
    sqrt(0.12297)
     = 0.3507 meter per second

Metal:
final velocity: x = 0.1589, y = -0.5489
vf = square root of (0.1589^2+0.5489^2)
     = sqrt(0.3265)
     = 0.5714 meter per second

Conclusion:

Based on the law of conservation of momentum, the momentum is conserve during elastic or inelastic collision. In other word, the product of mass and velocity will become the same. According to this law, we are able to use LoggerPro to enter some given data about object(mass, weight..) and then use video camera to record distance traveled in certain amount of time, which give us velocity. We are able to use mass and velocity to find its momentum. With the given data, on the other hand, we can manually calculate the momentum to see if it match with LoggerPro data. However, our data DID NOT match exactly. The error may due to static or kinetic friction on the surface of balls or glass. Also, it might due to the dots we plotted, it might be a little off. But overall, the data is similar to what it should be.

Sunday, October 16, 2016

Lab#11: Kinetic Energy and the Work-Kinetic Principle

Kinetic Energy & Work-Kinetic Principle

Samuel
Ellis
Mia
10-5-2016

Purpose:

To measure the work done as we stretch cart with spring acting on opposite direction.

Theory:

We all know the formula work equal to force times distance and the law of conservation of energy. By assuming there's no friction, the energy will equal to each other. Furthermore, when a cart is moving on a surface with a spring attach on the opposite direction, the kinetic energy will equal to spring potential energy. Then we can determine the force acting on the spring and its velocity.

Procedure:

EXPT 1.
1. Calibrate the force prob with a force of 4.9 N applied.
2. Set up the ramp, cart, motion detector, force prob, and spring.
3. Use cart stopper at the end of ramp
4. Be sure the motion detector sees the cart over the whole distance of interest.
5. Open the experiment file called L11E2-2 to display the force vs. position axes.
6. Zero the force prob and motion detector with the same supported loosely and un-stretched.
7. Verify that motion detector is set to "Reverse Direction", so that toward the detector is positive.
8. Begin graphing force vs position as the cart is moved slowly towards the motion detector until spring is stretched about 0.6 m.

EXPT 2
1. Use same set up as above.
2. measure the mass of the cart
3. Under control, new calculated column, enter a formula that would allow you to calculate the kinetic energy of the cart at any point.
4. Be sure that motion detector sees the cart over the whole distances of interest.
5. Make sure that x-axis of your graph is "position". Zero the force porb with the spring hanging loosely. Also zero the motion detector, so both the forced and position are zero in the starting position. Then pull the cart along the track so that the spring is stretched about 0.6 m from the un-stretched position.
6. Begin graphing. and releasing the cart, allowing the spring to pull it back at least to the un-stretched position.
7. Find the change in kinetic energy of the cart after it is released from the initial position to several different final position. Use the Analysis, Examine feature of the software. Also find the work done by the spring up to that position. Record these values of work and change in kinetic energy in a table determine from your graph the position of the cart where it is released and record in in the table.


Data:

( Above is the graph that shows time, force, position and kinetic energy. When the cart started to accelerate toward spring, the motion sensor calculate the change in distance. Furthermore, kinetic energy column was calculated by input equation of 0.5*m*v^2, in which mass is given and velocity is based on the motion sensor.  


Conclusion:

In this experiment, we released spring to see how fast the cart we accelerate and distance it traveled. By using force prob and motion sensor, it capture wave very rapidly. So we can have an accurate data. We did find the area under the curve from different energy and work. Since work and kinetic energy are related, we can set them equal to each other to measure our answer come out correctly. The one only error I know is that between wheels and track there's little kinetic friction acting on it. It will affect the speed of the cart, which can ultimately affect work(force * distance). Since work don't require what happen between wheels and track, the final answer will come out slightly different.


Lab #9: Centripetal Force with Motor

Centripetal Force with Motor 

Samuel
Ellis
Mia
10-3-2016

Purpose:

To determine the relationship between angular frequency to angle at which it swing.

Theory:

When an object is spinning, there will be a centripetal force acting on the object. In addition, faster the spin is, the higher the object will be. Since centripetal force is increasing, the force in y-component is also increasing. In result, object will increase in height. We can use height, angle and time to determine it velocity.

Procedure : 

1. An electric motor mounted on a surveying tripod.
2. A long shaft going vertically up form the shaft.
3. A horizontal rod mounted on the vertical rod.
4. A long string tied at the end of the string.
5. A ring stand with a horizontal piece of paper or tape sticking out. 
6. Start motor, and make sure object hit the paper.
7. Record height of paper and time for 10 rotation.
7. Increase speed and repeat same procedure.


List/Data:

(1)
t = 31.06 sec
h = 63 cm

(2)
t = 26.75 sec
h = 92.3 cm

(3)
t = 23.7 sec
h = 102.3 cm

(4)
t = 19.16 sec
h = 144.3 cm

(5) 
t = 15.46 sec
h = 167.8 cm

(6)
t = 34.00 sec
h = 51.5 cm

Calculated Result:


H = 203.8 cm
R = 70 cm
L = 185.1 cm
h_initial = 127.6 cm
θ_initial = 43.57 degree


ω = θ/t  = (2*π*10)/t

   T*sin(
θ) = m*r*ω^2
/  T*cos(θ)= m*g
_______________________
   Tan(θ) = (r*ω^2)/g

Sqrt((g*tan(θ))/r) = ω

  ω      
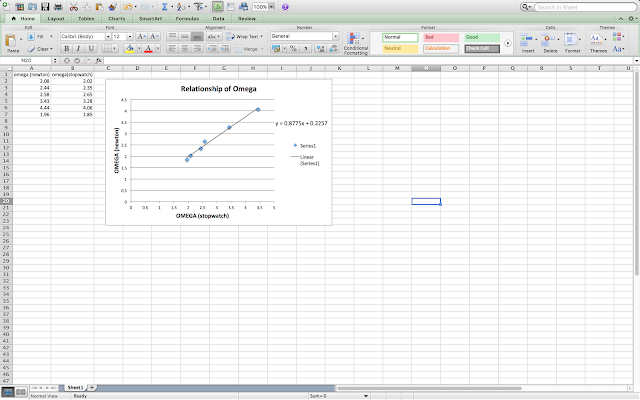
2.08   2.02
2.44   2.35
2.58   2.65 
3.43   3.28
4.44   4.06
1.96   1.85


(Above is the graph of ω(stopwatch) vs. ω(height) graph. By plotting omega time verse omega height, we can linear fit the slope and get the resulting angular velocity(0.8775))

Conclusion:

This experiment is based on centripetal force and its angular velocity. We first set motor to same voltage, which gave consistent velocity to spinning object. Then used paper as a hit point to see what's the resultant height of different centripetal forces. There's a little different between calculated value and actual value. My first assumption is air-resistant, we did not include air-resistant into our experiment. Air-resistant depend on size and speed of the object, bigger or faster the object, more air-resistant will have. Since we kept on increasing the spinning velocity, which increase it force. Then the air-resistant will also increase, result in little different from calculated value from actual value. Also, human error, the measuring tool we used to measure the height is regular ruler. There might be slight error from human eyes based on different angle from what he/she viewed. 


Lab #8: Centripetal Acceleration vs. Angular Frequency

Centripetal Acceleration vs. Angular Frequency 

Samuel
Ellis
Mia
9-28-2016

Purpose: 

  To determine the relationship between acceleration and angular speed.

Theory:

Centripetal acceleration , a = r*w^2. Centripetal acceleration can be determine by the radius of disk and how fast is the disk rotating. When an object is on the rotating disk, there's will be a centripetal acceleration force point to the center of the circle and a tangential force point perpendicular to the centripetal force. Based on what we know about centripetal acceleration, we can find centripetal force acting on the object.

Procedure:

1. Place the accelerometer under on the disk and connect them to the wheel. Verify that accelerometer reads 0 in the x-direction.
2. Place wheels up against the bottom of the disk. On the top of the disk, place an object with know distance from center of disk. 
3. Connect force prob to the object. 
4. Tape a piece of paper on the edge of the disk. Measure scanner can scan it every time paper pass through.
5. Collect period and acceleration data for a variety of rotational speeds by varying the voltage from the power supply feeding the motor. 

List/Data

(1)
r = 20.5cm
6.4 v
200g
t = 16.5sec

(2)
r = 29.5cm
6.4v
200g 
t = 15.4sec

(3)
r = 41cm
6.4v
200g
t = 14.37sec

(4) 
r = 58cm
6.4v
200g
t = 14.33sec

(5)
r = 58cm
7.0v
200g
t = 12.38sec

(6)
r = 58cm
7.6v
200g
t = 11.16sec

(7) 
r = 58cm
7.3v
200g
t = 12.47sec

(8)
r = 58cm
7.3v
50g
t = 10.74sec

Graphs

(Above is the graph of r*w^2 vs. force graph. We used r*w^2 instead of m*r*w^2, so we can use the slope to determine the mass. The slope is 0.2028, which is close to the mass of the object 0.2 kg.)


(Above is the graph of w^2 vs. force graph. we used of w^2 instead of m* r*w^2 so that we can use slope to find mass times radius. The slope is 0.1267 which is close to real mass times radius, 0.116.)

Conclusion:


  Based on what we know about centripetal acceleration, we are able to use formula to find its radius, angular frequency and mass. By plotting those point into LoggerPro, and use linear fit to find its slope; which will give us the expected value for radius, angular frequency and mass. In this experiment, our expected value was indeed close to actual value, however, there are some error occur during experiment that cause data not exactly match with given value. First, in between wheels and the disk, where are several gap in between that might give inconsistent kinetic friction that cause disk move slower or faster. Also, data was given in 2 to 3 significant figure, which is not precise compare to data in LoggerPro(5 sig fig).